CBAM steel costs vary by a factor of 19 between production routes: a BF-BOF mill exporting to the EU faces approximately €96 per tonne at the current €70/tCO₂ ETS price, while a scrap-EAF producer faces just €5 per tonne under the same conditions. For non-EU exporters shipping steel to the EU under Regulation (EU) 2023/956, production route is the single most important variable in calculating embedded emissions liability and building a viable market strategy.
The 2.5% CBAM factor active in 2026 keeps immediate net costs modest, but the factor rises to 48.5% by 2030, turning today's manageable figures into a structural competitive issue. This guide covers exact cost calculations by route, the data obligations exporters face, and the strategic options available from 2026 onward.
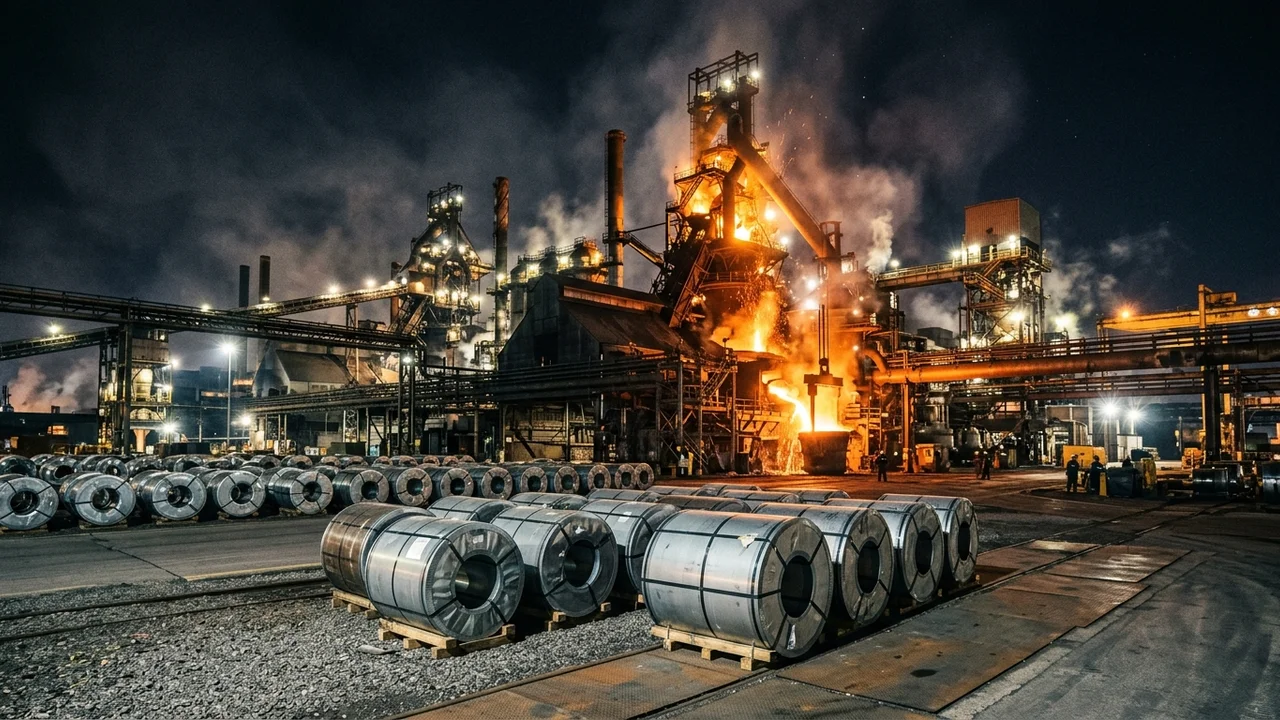
Caption: CBAM steel cost by production route at €70/tCO₂, showing the divergence between BF-BOF and scrap-EAF embedded emissions.
CBAM Steel Cost by Production Route: 2026 and 2030
The EU carbon border adjustment mechanism prices steel imports based on specific embedded emissions at the production installation, multiplied by the EU ETS certificate price, multiplied by the applicable CBAM factor for that year. Three officially defined production routes each carry distinct benchmark emission levels under Implementing Regulation (EU) 2025/2621.
The table below shows gross CBAM cost (before CBAM factor), net CBAM cost applying the 2026 and 2030 factors, and the illustrative 2030 cost using the consensus ETS price forecast of €126/tCO₂.
| Production Route | Benchmark (tCO₂e/t) | Gross Cost @ €70 | Net Cost 2026 (2.5%) | Net Cost 2030 (48.5%) | Net Cost 2030 @ €126 |
|---|---|---|---|---|---|
| BF-BOF (Blast Furnace, Basic Oxygen Furnace) | 1.370 | €95.90/t | ~€2.40/t | ~€46.50/t | ~€83.80/t |
| DRI-EAF (Direct Reduced Iron, Electric Arc) | 0.481 | €33.67/t | ~€0.84/t | ~€16.33/t | ~€29.40/t |
| Scrap-EAF (Electric Arc, scrap-based) | 0.072 | €5.04/t | ~€0.13/t | ~€2.44/t | ~€4.40/t |
Route classification follows a majority-input rule: when more than 50% of crude steel mass originates from blast furnace pig iron, the installation is BF-BOF. When more than 50% derives from recycled scrap, it is Scrap-EAF. DRI-EAF applies when direct reduced iron dominates the charge.
The figures above use official CBAM benchmarks from IR 2025/2621, not the higher country-specific default values that apply when exporters fail to provide verified actual emissions data. The China steel slab default, for example, stands at 3.167 tCO₂e/t — more than twice the BF-BOF benchmark. Exporters who rely on defaults pay a 10% mark-up in 2026, rising to 30% from 2028 onward.
How Embedded Emissions Are Calculated for CBAM Steel
Embedded emissions for CBAM steel are the direct CO₂ emissions per tonne of crude steel produced, calculated at the production installation level using the methodology in Implementing Regulation (EU) 2025/2547. Indirect emissions from electricity consumption are excluded for steel; EU steel producers receive ETS compensation for electricity costs, and including indirect CBAM while compensating domestic producers would create an asymmetry.
Two calculation methods are available to non-EU producers. The calculation-based method (Equation 11) uses activity data multiplied by emission factors from laboratory analyses of fuel and raw material carbon content. The mass balance method (Equation 12) accounts for all carbon inputs to the production process and subtracts carbon outputs, allocating the remainder to the steel product. Both methods require a monitoring plan that defines system boundaries across all linked production processes.
Scrap input is zero-rated for CBAM purposes. A BF-BOF installation that increases its scrap charge therefore reduces its calculated specific embedded emissions. This creates a direct financial incentive to document and maximize scrap use, particularly as the CBAM factor accelerates after 2027.
How does the exporter's data reach the EU importer? The non-EU producer uploads verified installation-level data to the CBAM Operators Portal, making it available to all EU buyers in a single submission. Without this, the EU importer defaults to country-specific punitive values and passes the extra cost back through lower purchase prices.
What CBAM Means for Non-EU Steel Exporters in Practice
Non-EU steel exporters carry no direct legal obligation under CBAM. The financial and reporting obligation falls on the EU-authorized CBAM declarant (the EU importer). The commercial effect is nevertheless immediate: the EU importer's certificate cost is directly linked to the embedded emissions figure attached to each shipment, so exporters who provide low verified emissions attract buyers, and exporters relying on high defaults lose price competitiveness.
For non-EU exporters, the 4 commercial consequences of CBAM are listed below.
- EU buyers apply the embedded emissions figure to calculate their certificate obligation. A lower verified figure reduces the buyer's cost and strengthens the commercial relationship.
- Default values are punitive by design. The 10–30% mark-up schedule in IR 2025/2621 is explicitly intended to incentivize data provision. By 2028, using defaults costs an additional 30% over the benchmark-based calculation.
- Verified data can be used with all EU buyers. One upload to the CBAM Operators Portal covers multiple EU importers simultaneously, making the verification investment scalable.
- The cost pressure accelerates steeply between 2028 and 2030. The CBAM factor jumps from 10% in 2028 to 48.5% in 2030. Exporters who delay decarbonization or data provision will face structurally higher costs in that window.
The CBAM steel guide covers the full sector context, including CN codes (Chapters 72 and 73), precursor rules for hot-rolled coil, and the treatment of downstream products such as pipes and structural sections.
Which Countries Face the Highest CBAM Steel Exposure?
India, Turkey, and China are the three largest non-EU steel exporters to the EU by volume, and each faces a distinct CBAM risk profile based on production mix and domestic carbon pricing.
India exported approximately 4.33 million tonnes of steel to the EU in 2024, with a trade value of €3.9 billion. Indian steel production is BF-BOF dominant, with typical embedded emissions of 1.8–2.1 tCO₂/t at major integrated mills. India's Carbon Credit Trading Scheme remains in pilot phase and does not currently qualify for the Article 9 deduction that would allow EU importers to offset CBAM certificate costs against carbon prices already paid upstream.
Turkey exported approximately 2.59 million tonnes to the EU in 2024, drawing on a mixed production base of BF-BOF and scrap-EAF capacity. Turkey's average steel carbon intensity of approximately 1.2 tCO₂/t reflects this mix. Turkey operates no qualifying carbon pricing scheme as of April 2026, so no Article 9 deduction is available. Turkey is also the EU's largest cement exporter, amplifying its overall CBAM exposure across sectors.
South Korea exported approximately 3.38 million tonnes to the EU in 2024, with K-ETS (Korea Emissions Trading Scheme) applying across the steel sector. South Korea's K-ETS has operated since 2015 and covers approximately 70% of national emissions. If the European Commission formally recognizes K-ETS as a qualifying scheme under Article 9 of Regulation (EU) 2023/956, South Korean steel producers would gain a deduction that directly reduces their EU buyers' net CBAM certificate cost, offering a meaningful competitive advantage over producers from countries without carbon pricing.
Caption: CBAM steel exposure by major non-EU exporting country, showing production route mix and carbon pricing status as of April 2026.
What Non-EU Steel Producers Must Provide to EU Buyers
CBAM creates a data requirement that flows from EU importer back to non-EU producer. The EU importer needs specific embedded emissions data for each production installation to calculate their CBAM certificate obligation accurately and avoid default values.
The 5 data categories required from a non-EU steel installation are listed below.
- Installation identification: Company name, physical address, UN/LOCODE, geographical coordinates, and the steel mill identification number assigned for CBAM purposes.
- Production route classification: Confirmation of which Commission-defined route applies (BF-BOF, DRI-EAF, or Scrap-EAF) and the scrap input percentage.
- Specific direct embedded emissions: tCO₂e per tonne of steel produced, calculated using either the calculation-based or mass balance method under IR 2025/2547.
- Monitoring plan: A document defining system boundaries, all emission sources covered, measurement instruments used, and data quality procedures.
- Carbon price data (if applicable): For Article 9 deduction eligibility, documentation of the carbon price effectively paid per tonne CO₂e, net of any free allocations received, from a qualifying domestic scheme.
Verification by an accredited third-party verifier (accredited under EN ISO/IEC 14065 by an EA-recognized National Accreditation Body) is mandatory for data used in 2026 declarations. A physical site visit to the production installation is required for the first verification period. Verifier fees typically range from €5,000 to €50,000 per installation per reporting period, depending on installation complexity and travel requirements.
How Should Non-EU Steel Exporters Respond to CBAM?
The strategic responses available to non-EU steel exporters differ by time horizon, capital availability, and current emissions intensity. Four options are available, from immediate low-cost measures to long-term structural investments.
Option 1: Measure and verify actual emissions now. Exporters whose actual emissions fall below the country-specific defaults — which is likely for most producers with modern equipment — gain immediate cost advantages. The financial benefit is small in 2026 (2.5% CBAM factor) but substantial by 2030 (48.5% CBAM factor). A producer with actual BF-BOF emissions of 1.8 tCO₂/t versus a country default of 3.167 tCO₂/t saves approximately €48/t in net CBAM cost by 2030 at €70/tCO₂.
Option 2: Increase scrap charge. Because scrap input is zero-rated, increasing the recycled scrap proportion in BF-BOF or EAF production directly reduces declared embedded emissions. This requires no new process technology and can often be achieved through procurement changes within 12–18 months.
Option 3: Invest in DRI-EAF or hydrogen-DRI capacity. DRI-EAF based on natural gas carries a benchmark of 0.481 tCO₂e/t, compared to 1.370 for BF-BOF. Hydrogen-DRI approaches near-zero embedded emissions. This pathway requires capital investment in the range of several hundred million euros for a greenfield installation, with a 5–10 year implementation horizon.
Option 4: Support domestic carbon pricing development. Countries whose governments establish a qualifying carbon pricing scheme under the criteria of Regulation (EU) 2023/956 Article 9 create an Article 9 deduction mechanism that directly offsets EU importer certificate costs. This is a medium-term option requiring political action, but it provides systemic relief across all producers in the country.
Diverting exports away from the EU to non-CBAM markets is an option for 2026–2027, but the UK CBAM launches in January 2027 and Canada is developing an equivalent mechanism. The window for non-CBAM market diversion narrows annually.
CBAM Steel: How Does It Compare to CBAM for EU Importers?
Non-EU steel exporters and EU steel importers occupy opposite sides of the same compliance relationship. The exporter generates the embedded emissions data; the importer reports it, holds CBAM certificates against it, and surrenders those certificates by September 30 each year starting in 2027. For CBAM for non-EU exporters the key question is how to minimize the certified emissions figure and maximize pricing competitiveness. For EU importers, the question is how to manage certificate acquisition, quarterly holding requirements (at least 50% of cumulative embedded emissions), and declaration accuracy.
How CBAM Affects Turkish Steel Exports
CBAM affects Turkish steel exports through the combination of no qualifying domestic carbon price, approximately 2.59 million tonnes per year in EU-directed shipments, and a mixed BF-BOF and scrap-EAF production base. At the current ETS price and 2026 CBAM factor, the immediate financial impact is small. At 48.5% CBAM factor in 2030, a BF-BOF-sourced tonne of Turkish steel carries a net CBAM cost of approximately €46.50. Turkey's accelerating ETS development under EU pressure may provide partial Article 9 relief if the scheme becomes operational and qualifies before 2028. Full country analysis is available at CBAM Turkey.
How CBAM Affects Indian Steel Exports
CBAM affects Indian steel exports as one of the sector's highest-volume challenges: India's 4.33 million tonne EU export figure and BF-BOF-dominant production mix create the largest aggregate CBAM exposure of any single country. The CCTS pilot scheme does not currently qualify for Article 9 deduction. JSW Steel, Tata Steel, and SAIL are the 3 largest Indian exporters to the EU, and each faces growing pressure to provide verified actual emissions data to maintain pricing competitiveness. Full country analysis is at CBAM India.
Is CBAM a Tax on Steel Imports?
CBAM is not a tax on steel imports. CBAM is a certificate-based mechanism under Regulation (EU) 2023/956 that requires the EU importer (not the non-EU exporter) to purchase certificates proportional to the embedded CO₂ emissions of their imports, priced at the EU ETS auction clearing price. The financial obligation falls on the EU authorized CBAM declarant, not on the non-EU producer. The commercial effect on exporters is indirect: higher certificate costs increase landed costs for EU buyers, who may negotiate lower purchase prices or switch to lower-emission suppliers.
Does CBAM Apply to All Steel Products?
CBAM applies to steel products listed in Annex I of Regulation (EU) 2023/956, covering CN codes in Chapters 72 and 73 of the Combined Nomenclature. Products covered include pig iron (7201), semi-finished steel (7207), flat-rolled products (7208–7212), bars and rods (7213–7217), and pipes and tubes (7303–7307). Ferrous waste and scrap (CN 7204) is explicitly excluded. The de minimis threshold of 50 tonnes annual mass per importer exempts small-volume trade relationships, though importers above that threshold must comply regardless of individual shipment size.
What Is the Default Value for Chinese Steel Under CBAM?
The default embedded emissions value for Chinese steel slab under CBAM is 3.167 tCO₂e/t as set in Implementing Regulation (EU) 2025/2621. This is more than double the BF-BOF benchmark of 1.370 tCO₂e/t, creating a very strong financial incentive for Chinese producers to provide verified actual data. At 48.5% CBAM factor in 2030 and €70/tCO₂, the difference between using the China default versus the benchmark represents a cost gap of approximately €47/t. Full default value methodology and country-by-country figures are at CBAM default values for exporters.
Can EU Importers of Steel Claim a Deduction for Carbon Prices Paid by the Exporter?
EU importers can claim an Article 9 deduction under Regulation (EU) 2023/956 when a qualifying carbon price has been effectively paid in the country of production. The deduction reduces the number of CBAM certificates the importer must surrender. Qualifying requires: a legally binding carbon pricing scheme in the producing country, a price actually paid per tonne CO₂e (net of any free allocations or rebates), and documentation provided by the exporter. Voluntary carbon offsets, corporate shadow prices, and government energy subsidies do not qualify. For steel, South Korea's K-ETS is the only active scheme with a realistic path to Article 9 qualification as of April 2026, with the Commission's formal assessment pending. EU steel importers sourcing from CBAM-affected countries should review the CBAM steel guide for importers for the full obligations chain.