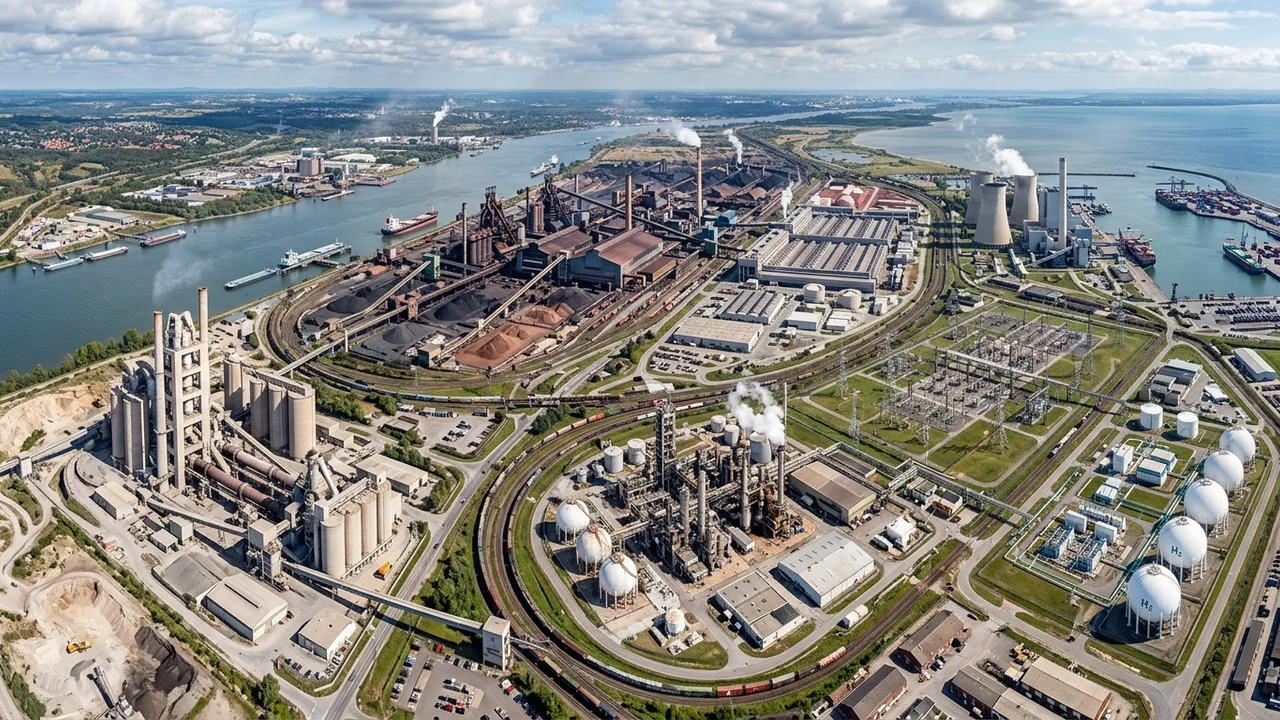
EU CBAM covers 6 sectors under Regulation (EU) 2023/956, effective January 1, 2026: iron and steel, cement, aluminium, fertilizers, electricity, and hydrogen. Each sector carries distinct greenhouse gases, a different scope of emissions priced, and emission factors that range from near zero (green hydrogen) to more than 10 tCO2e per tonne (grey hydrogen). Understanding how each sector works under CBAM determines what EU importers must pay and what non-EU exporters must document.
The sectors were chosen because they represent the carbon-intensive goods most at risk of carbon leakage from the EU Emissions Trading System. A full guide to the mechanism behind CBAM is available in the EU CBAM guide. The sections below explain what distinguishes each sector, which products fall within scope, and what the financial exposure looks like at the current EU ETS price of approximately €70 per tonne CO2.
What Are the 6 CBAM Covered Sectors?
EU CBAM's 6 covered sectors are iron and steel, cement, aluminium, fertilizers, electricity, and hydrogen, all listed in Annex I of Regulation (EU) 2023/956 with their corresponding CN codes. Each sector is covered because it is both carbon-intensive in production and exposed to competition from countries without equivalent carbon pricing.
The table below compares all 6 CBAM sectors across the attributes that matter most for compliance: which greenhouse gases are priced, whether direct emissions alone or both direct and indirect emissions are included, and what the emission factor range is per tonne of product.
| Sector | GHGs Covered | Direct Emissions | Indirect Emissions | Emission Factor Range (tCO2e/t) |
|---|---|---|---|---|
| Iron and steel | CO2 | Priced | Not priced | 0.07–2.5 (route-dependent) |
| Cement | CO2 | Priced | Priced | 0.40–0.87 |
| Aluminium | CO2 + PFCs (CF4, C2F6) | Priced | Not priced | 0.05–2.1 (direct only) |
| Fertilizers | CO2 + N2O | Priced | Priced | 1.0–2.6 |
| Electricity | CO2 | Priced | N/A | Country grid-specific |
| Hydrogen | CO2 | Priced | Not priced | 0–12 (production route) |
Two sectors, cement and fertilizers, price both direct and indirect emissions. The remaining 4 sectors, iron and steel, aluminium, electricity, and hydrogen, are listed in Annex II of the regulation, meaning only direct emissions are priced. For aluminium, this distinction is commercially significant: a smelter powered by a coal-heavy grid can carry up to 12–16 tCO2e per tonne in total, but CBAM prices only the 1.5–2.1 tCO2e from direct anode consumption and perfluorocarbon emissions.
The de minimis threshold of 50 tonnes annual mass per importer, introduced by the Omnibus Regulation (EU) 2025/2083, exempts small-volume importers across 4 sectors: iron and steel, cement, aluminium, and fertilizers. Electricity and hydrogen have no de minimis threshold.
Iron and Steel: The Largest CBAM Sector by Trade Volume
Iron and steel is the largest CBAM sector by EU import value, with India, South Korea, China, Turkey, the UK, and Ukraine accounting for the dominant share of covered goods entering the EU. CBAM steel products span CN chapters 72 and 73, including pig iron (7201), semi-finished products (7207), flat-rolled products (7208–7212), bars and rods (7213–7217), tubes and pipes (7303–7307), and structural components (7308).
The emission factor for steel varies by production route. Blast furnace-basic oxygen furnace (BF-BOF) steel, which dominates production in India and China, carries a direct emission factor of approximately 2.0–2.5 tCO2 per tonne. Electric arc furnace (EAF) steel, which melts recycled scrap and is the dominant route in Turkey and parts of southern Europe, carries 0.3–0.5 tCO2 per tonne. The CBAM benchmark value from Implementing Regulation (EU) 2025/2621 is 1.370 tCO2e/t for BF-BOF, 0.481 for DRI-EAF, and 0.072 for scrap-EAF.
CBAM steel applications that use CBAM steel imports must report embedded emissions at the installation level, with scrap content documented separately. Pre-consumer and post-consumer scrap carry zero embedded emissions under the regulation, creating a direct compliance advantage for exporters with high recycled content.
At €70 per tonne CO2, a BF-BOF steel shipment carries a gross CBAM cost of approximately €140 per tonne. Because free allocation from the EU ETS still covers 97.5% of the domestic equivalent in 2026, the net certificate obligation is just 2.5% of that gross figure: approximately €3.50 per tonne in 2026. That share rises steeply through 2030, when only 51.5% of free allocation remains.
Cement: Highest Process Emissions Per Tonne
Cement produces unavoidable CO2 emissions from limestone calcination, a chemical reaction (CaCO3 to CaO + CO2) that accounts for approximately 60% of the sector's carbon footprint and cannot be eliminated through energy efficiency measures alone. The remaining 35% comes from kiln fuel combustion, and approximately 5% from electricity consumption.
Cement and clinker are covered under CN codes 2523 10 (cement clinker), 2523 21 (white Portland cement), 2523 29 (other Portland cement), 2523 30 (aluminous cement), and 2523 90 (other hydraulic cements). The clinker-to-cement ratio in the final product determines the specific embedded emissions under Equation 64 of IR 2025/2547: a CEM I product with 95–100% clinker has the highest embedded emissions, while a CEM III product with only 5–64% clinker carries substantially less.
Cement is one of the 2 sectors where indirect emissions (electricity consumed in production) are also priced. This applies because EU cement producers do not receive state aid compensation for indirect carbon costs, meaning pricing indirect emissions for imports creates no asymmetry with domestic treatment.
Turkey supplies approximately 35–39% of EU cement imports, around 3.3–4.8 million tonnes annually. The default value for Turkish Portland cement under IR 2025/2621 is approximately 1.584 tCO2e per tonne, which is roughly 80% higher than Turkey's actual average of approximately 0.88 tCO2 per tonne. At €70 per tonne CO2 and using default values, Turkish cement faces a gross CBAM cost of approximately €83 per tonne, a figure that in many cases exceeds the FOB export price of the cement itself. This creates one of the strongest financial incentives in any sector to provide verified actual emission data rather than relying on defaults.
Aluminium: CO2 and Perfluorocarbons, Direct Emissions Only
Aluminium is the only CBAM sector that covers perfluorocarbons (PFCs) alongside CO2. Two specific PFCs are included: CF4 (tetrafluoromethane, with a global warming potential of 6,630) and C2F6 (hexafluoroethane, GWP 11,100). These gases are released during anode effect events in the Hall-Heroult electrolysis process when alumina concentration drops below the operating threshold.
Products covered span CN chapter 76, including unwrought aluminium (7601), bars and rods (7604), wire (7605), plates and sheets (7606), foil (7607), tubes and pipes (7608), structural components (7610), and other aluminium articles (7616). Secondary aluminium from recycled scrap (CN 7602) carries zero embedded emissions and is not subject to CBAM obligations.
Despite being one of the most electricity-intensive industrial processes at 14–16 MWh per tonne of primary aluminium, the sector prices direct emissions only. Indirect emissions from electricity consumption are excluded because EU aluminium producers receive state aid compensation for indirect carbon costs under Article 10a(6) of the EU ETS Directive. The practical consequence is significant: a smelter in the UAE or Bahrain, powered by natural gas, carries 7–9 tCO2e per tonne in total but faces CBAM on only approximately 1.5–2.1 tCO2e per tonne in direct emissions.
Norway and Iceland, the two largest aluminium producers with access to hydropower and near-zero direct emissions, are exempt from CBAM as EEA members. China, Turkey, the UAE, and Bahrain are the primary non-exempt sources of EU aluminium imports, each facing different direct emission profiles based on their production technology and power sources.
Fertilizers: Two GHGs, Including N2O from Production
Fertilizers are one of the 2 CBAM sectors that price both direct and indirect emissions, and one of the 2 sectors that cover a GHG beyond CO2, specifically N2O (nitrous oxide) from the nitric acid production stage. Covered products include anhydrous ammonia (2814 10 00), urea (3102 10), ammonium nitrate (3102 30), calcium ammonium nitrate (3102 60), UAN solutions (3102 80), and mixed nitrogen fertilizers (3105).
All nitrogen fertilizers originate from ammonia produced via the Haber-Bosch process, which combines atmospheric nitrogen with hydrogen derived almost entirely from natural gas via steam methane reforming. The CO2 from that reforming process is the primary emission source, generating approximately 1.6–2.4 tCO2 per tonne of ammonia. For ammonium nitrate and UAN products, N2O from nitric acid production adds a further significant load: without abatement, approximately 1.59 tCO2e per tonne of nitric acid at IPCC AR5 GWP.
Urea carries an emission factor of approximately 2.3–2.6 tCO2e per tonne, the highest of the covered fertilizer products. At €70 per tonne CO2, gross CBAM cost for urea reaches approximately €175 per tonne. Russia and Belarus historically supplied approximately 34% of EU nitrogen fertilizer imports. Post-July 2025 EU tariff measures, which escalate from €40–45 per tonne initially to €315–430 per tonne by July 2028, have already reduced Russian urea imports by approximately two-thirds. CBAM certificates add a further financial obligation from the first declaration year covering 2026.
One notable design choice: the default value mark-up for fertilizers is only 1% above the country-specific average, compared to 10% in 2026 (rising to 30% from 2028) for steel, cement, aluminium, and hydrogen. The Commission cited agricultural price sensitivity and food security as justification, set out in the Omnibus explanatory memorandum.
Electricity and Hydrogen: Two Sectors With No De Minimis Threshold
Electricity and hydrogen share two distinguishing features: neither has a de minimis exemption, and both are listed in Annex II (direct emissions only). Every quantity of covered electricity and hydrogen imported into the EU is subject to CBAM obligations regardless of volume.
Electricity: Country Default Values Are the Norm
Electricity is covered under a single CN code, 2716 00 00, measured in MWh rather than tonnes. Unlike the industrial goods sectors, default values are the standard calculation method for electricity, not a fallback. Actual emission values may only be used when 5 conditions from Annex III, point 5 are all simultaneously satisfied: a power purchase agreement with a named generator, direct grid connection or no interconnector congestion, an installation emission intensity at or below 550 g CO2 per kWh, electricity firmly nominated to allocated interconnection capacity, and hourly matching between nomination and actual generation.
In practice, meeting all 5 conditions simultaneously is extremely difficult. The result is that virtually all electricity CBAM calculations use country-level grid emission factor defaults. Countries exempt from CBAM under Annex III include Norway, Iceland, Liechtenstein, and Switzerland. The UK, despite operating its own UK ETS, is not exempt, meaning electricity exports from the UK to France, the Netherlands, Belgium, and Denmark via the IFA, BritNed, Nemo Link, and Viking Link interconnectors are subject to CBAM.
Hydrogen: Production Route Determines Everything
Hydrogen is covered under CN code 2804 10 00. The transitional default value is 10.4 tCO2 per tonne, reflecting the global dominance of steam methane reforming (grey hydrogen). The actual emission factor varies from approximately 10–12 tCO2/t for grey hydrogen, to 0.5–1.0 for blue hydrogen (with carbon capture), to near zero for green hydrogen produced via renewable electrolysis.
At €70 per tonne CO2, grey hydrogen carries a gross CBAM cost of approximately €700–840 per tonne of hydrogen. Green hydrogen certified as an RFNBO (Renewable Fuel of Non-Biological Origin) under Delegated Regulation (EU) 2023/1184 may use an emission factor of zero for electricity consumed in electrolysis, eliminating CBAM costs entirely. This cost differential makes hydrogen the sector with the most pronounced CBAM incentive for supply chain decarbonization over the medium term.
How the 6 CBAM Sectors Connect to the Broader Compliance Framework
The 6 CBAM sectors connect to a single compliance workflow: EU importers as authorized declarants calculate embedded emissions for each shipment, hold CBAM certificates equal to at least 50% of cumulative embedded emissions at each calendar quarter, and surrender the full annual amount by September 30, 2027 for goods imported during 2026. Understanding how CBAM embedded emissions are calculated for each sector is the prerequisite step before any certificate obligation can be quantified.
The financial exposure across all 6 sectors grows from a 2.5% CBAM factor in 2026 to 100% by January 1, 2034, as EU ETS free allocation phases out. The steepest increase occurs between 2029 and 2030, when the CBAM factor jumps from 22.5% to 48.5%. Importers with multi-year supplier contracts in any of the 6 sectors face financial planning decisions now that will determine their 2030 cost base.
Are All 6 CBAM Sectors Treated the Same Way?
No. The 6 CBAM sectors differ across 4 key dimensions: the greenhouse gases priced, whether indirect emissions are included, the availability of de minimis relief, and how default values are structured. Cement and fertilizers price both direct and indirect emissions. Aluminium is the only sector covering PFCs. Electricity and hydrogen have no de minimis threshold. Fertilizer default values carry only a 1% mark-up, while all other non-electricity sectors face a 10% mark-up in 2026, rising to 30% from 2028.
Does CBAM Apply to All Steel and Aluminium Products?
No. CBAM applies only to goods classified under the specific CN codes listed in Annex I of Regulation (EU) 2023/956. For steel, ferrous waste and scrap (7204) and household articles such as wire rope, chain, and sanitary ware are excluded. For aluminium, waste and scrap (7602) and table and kitchen articles (7615) are excluded. The CN code at the time of customs declaration determines scope, not the commercial description of the product.
Is Green Hydrogen Exempt From CBAM?
Green hydrogen is not exempt, but its CBAM cost is near zero. CBAM certificates are required for all hydrogen imports under CN code 2804 10 00, but the certificate quantity is calculated from embedded emissions. Hydrogen produced by renewable electrolysis and certified as an RFNBO under Delegated Regulation (EU) 2023/1184 carries embedded emissions approaching zero, making the resulting certificate obligation negligible. This is distinct from an exemption: the compliance obligation exists, but the financial exposure is minimal.
Which CBAM Sector Has the Highest Emission Factor?
Grey hydrogen has the highest emission factor of any CBAM product at approximately 10–12 tCO2 per tonne of hydrogen, compared to 2.0–2.5 for BF-BOF steel, 2.3–2.6 for urea fertilizer, 0.83 for Portland cement, and 1.5–2.1 for primary aluminium direct emissions. The transitional default for hydrogen is 10.4 tCO2 per tonne. At a sustained ETS price of €70 per tonne CO2 and full phase-in by 2034, grey hydrogen would face a CBAM cost of €700–840 per tonne, higher in absolute terms per unit than any other covered sector.
Will CBAM Expand to Additional Sectors After 2026?
A legislative proposal, COM(2025)989, published December 17, 2025, proposes expanding CBAM to approximately 180 downstream products from January 1, 2028, including vehicle parts, machinery, industrial radiators, and washing machines. This expansion has not been adopted as of April 2026. The 6 sectors established by Regulation (EU) 2023/956, iron and steel, cement, aluminium, fertilizers, electricity, and hydrogen, remain the only covered sectors in the definitive phase currently in force. Full details on CBAM calculation methods for each sector are available in the compliance section.
Caption: EU CBAM sectors compared by emissions scope, covered greenhouse gases, and indicative emission factors per tonne of product under Regulation (EU) 2023/956.
Caption: CN code chapter coverage for all 6 CBAM sectors, from Chapter 25 (cement) to Chapter 76 (aluminium) and Chapter 28/31 (fertilizers and ammonia).