CBAM aluminium indirect emissions represent the largest unpriced carbon gap in the entire Carbon Border Adjustment Mechanism: a Chinese primary aluminium smelter powered by coal-fired electricity emits roughly 12–16 tCO₂e per tonne in total, yet CBAM certificates cover only the ~1.5 tCO₂/t of direct emissions. The 80% of the carbon footprint locked inside electricity consumption sits entirely outside the pricing perimeter. Understanding why this gap exists, what it means for EU importers, and when it is likely to close is essential for any business that buys or sells aluminium in the EU market.
The short answer is structural: aluminium is listed in Annex II of Regulation (EU) 2023/956, which restricts CBAM pricing to direct emissions only. The longer answer involves a deliberate policy trade-off that connects EU state aid rules, electricity market distortions, and an explicit Commission commitment to revisit indirect coverage in a future review. This article unpacks each layer.
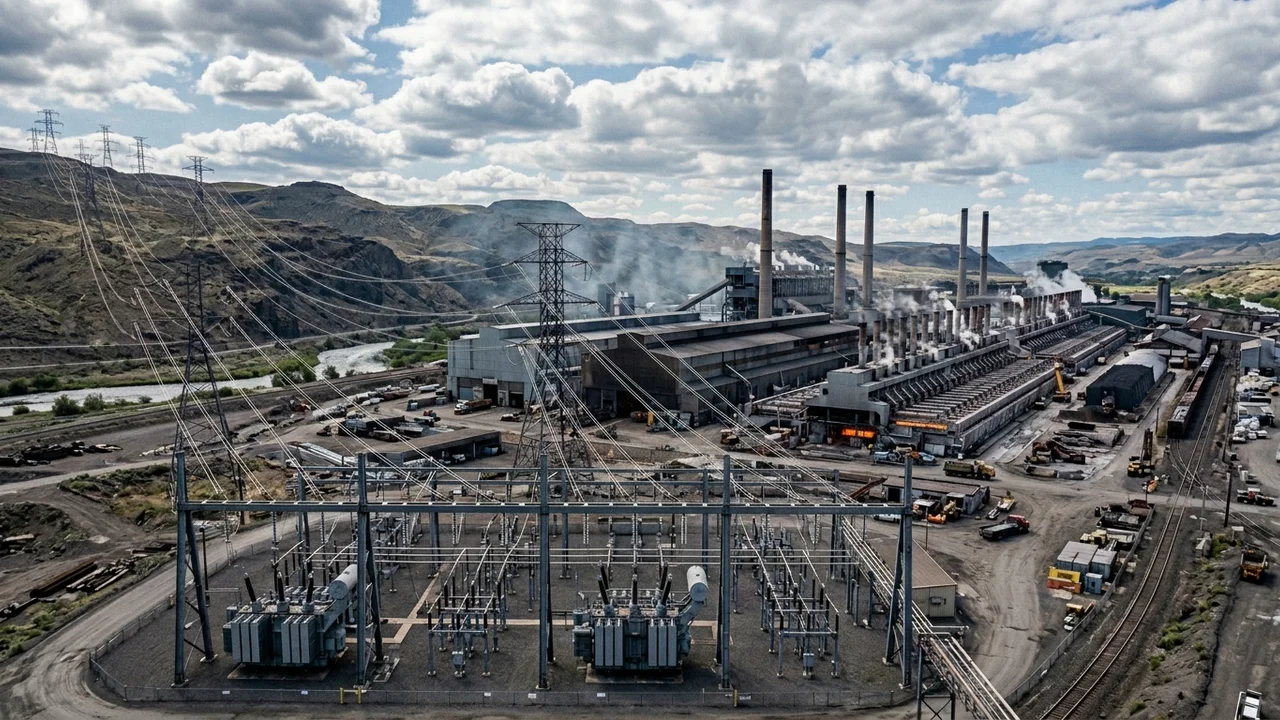
Caption: Primary aluminium production consumes 14–16 MWh per tonne, making electricity the dominant source of lifetime carbon output for a smelter powered by a coal-heavy grid.
What CBAM Actually Prices for Aluminium in 2026
Under Regulation (EU) 2023/956, CBAM prices only the direct emissions from aluminium production: CO₂ from carbon anode consumption and perfluorocarbons (PFCs) from the Hall-Héroult electrolysis process. Indirect emissions from electricity consumed during smelting are excluded. This scope restriction applies to all CN codes in Chapter 76, including unwrought aluminium (7601), plates and sheets (7606), wire (7605), and fabricated articles (7616).
The direct emission factor for primary aluminium runs approximately 1.5 tCO₂e per tonne. At the current EU ETS price of approximately €70/tCO₂ as of late March 2026, that produces a gross CBAM cost of roughly €105 per tonne before the free allocation adjustment. Because 97.5% of EU ETS free allocation remains in place in 2026 (CBAM factor = 2.5%), the net obligation in 2026 is small. The financial impact scales sharply toward 2030, when 48.5% of free allocation will have been phased out.
Two greenhouse gases fall within the direct emissions scope. The first is CO₂, released as the carbon anodes oxidize during electrolysis. The second is perfluorocarbons, specifically CF₄ with a global warming potential of 6,630 and C₂F₆ with a GWP of 11,100. PFC emissions occur during "anode effect" events when alumina feed concentration drops too low in the reduction cell. Modern smelters in Norway and Iceland minimize this through tight process control; legacy facilities in China, Russia, and certain Gulf Cooperation Council countries still generate significant PFC output. For EU importers, this means the declared direct emissions for Chinese primary aluminium can differ substantially from those of Icelandic primary aluminium, even before electricity is considered.
For a complete grounding in how the mechanism works across all sectors, the EU CBAM guide provides the full regulatory framework and obligation chain for authorized declarants.
Why Indirect Emissions Are Excluded: The Annex II Rule
Aluminium's exclusion from indirect emission pricing is not an oversight. It is a deliberate consequence of Annex II of Regulation (EU) 2023/956, which lists goods whose CBAM obligation covers direct emissions only. Steel, aluminium, and hydrogen all appear on Annex II for the same underlying reason: EU domestic producers in these sectors receive state aid compensation for their indirect carbon costs under Article 10a(6) of the EU ETS Directive.
The logic runs as follows. EU aluminium smelters pay an implicit carbon cost through their electricity bills because EU power generators pass through EU ETS compliance costs in the electricity price. To avoid harming the international competitiveness of EU smelters, member states are permitted to compensate them for a portion of those indirect costs. If CBAM then added an indirect emissions charge on imported aluminium while EU producers continued receiving compensation, the mechanism would create an asymmetric double-counting. The Commission chose consistency over comprehensiveness: no indirect CBAM for a sector that receives indirect ETS compensation domestically.
Recital 67 of the original regulation acknowledges this trade-off directly and states that the Commission intends to extend indirect coverage to aluminium "as soon as possible" once the interaction with state aid rules can be resolved. No formal proposal exists as of April 2026. The Article 30 review, due in the second half of 2025 and published in December 2025, confirmed CBAM is working as intended in its transitional phase but did not trigger an immediate amendment on indirect aluminium coverage.
The full calculation methodology for what does fall within scope, including how precursor emissions are allocated across downstream aluminium goods, is explained in the guide on how embedded emissions are calculated.
The Carbon Gap in Numbers: Direct vs. Total Footprint
The table below compares direct and total lifecycle emissions for primary aluminium across four representative electricity grids, using a standard smelting electricity intensity of 15 MWh per tonne.
| Production Location | Grid Carbon Intensity | Direct CO₂e (tCO₂e/t) | Electricity-Derived CO₂ (tCO₂e/t) | Total CO₂e (tCO₂e/t) | CBAM Prices |
|---|---|---|---|---|---|
| Norway / Iceland (hydro) | ~0.01 tCO₂/MWh | ~1.5 | ~0.15 | ~1.65 | 100% |
| UAE / Bahrain (natural gas) | ~0.5–0.6 tCO₂/MWh | ~1.5 | ~7.5–9.0 | ~9.0–10.5 | ~14–17% |
| India (coal-heavy grid) | ~0.7 tCO₂/MWh | ~1.5 | ~10.5 | ~12.0 | ~12.5% |
| China (coal-heavy grid) | ~0.7–0.8 tCO₂/MWh | ~1.5 | ~10.5–12.0 | ~12.0–13.5 | ~11–12.5% |
For a Chinese primary aluminium smelter operating on a coal-heavy grid, CBAM certificates in 2026 cover roughly 11–12.5% of the actual carbon footprint. For a Norwegian smelter using hydropower, CBAM covers nearly 100% of the footprint. That divergence is the structural competitive distortion the Annex II restriction creates.
The per-tonne cost differential at a €70/tCO₂ ETS price is striking. A Chinese smelter pays approximately €105 per tonne in gross CBAM costs based on direct emissions alone. If indirect emissions were included and valued at the same carbon price, the total gross CBAM obligation would approach €840–945 per tonne for coal-grid production. The current regime leaves a gap of approximately €735–840 per tonne unpriced.
What EU Importers of Aluminium Need to Do in 2026
Under the definitive phase, which began January 1, 2026, EU importers of aluminium goods must be authorized declarants by March 31, 2026 to continue importing during the phase. Certificate purchases begin on February 1, 2027, and the first CBAM declaration covering calendar year 2026 is due September 30, 2027. The declaration must report the verified embedded direct emissions of all imported aluminium goods above the 50-tonne annual mass de minimis threshold.
Four practical obligations define the 2026 compliance posture for aluminium importers.
The four obligations are listed below.
- Obtain authorized declarant status from the competent authority in your member state before the March 31, 2026 deadline.
- Request verified emissions data from each non-EU aluminium supplier, covering CO₂ from anode consumption and PFC emissions from anode effect events.
- Decide whether to use actual verified emissions or CBAM default values, noting that the 2026 default mark-up for aluminium is +10% above the calculated default under Implementing Regulation (EU) 2025/2621.
- Begin building the documentation trail for the September 30, 2027 declaration, including verified reports for each installation that produced the imported goods.
Importers sourcing from Norway, Iceland, or Switzerland face zero CBAM obligation because those countries are exempt under Annex III of the regulation. EEA membership and Switzerland's linked ETS place their exports outside CBAM scope entirely. Sourcing shifts toward exempt origins have already been reported across the EU aluminium supply chain.
The CBAM aluminium sector guide covers the full CN code list, the precursor allocation rules for downstream fabricated products, and country-by-country exposure across the major suppliers.
The Contextual Border: When Might Indirect Emissions Be Priced?
The Commission's path to including indirect emissions in CBAM aluminium pricing runs through two obstacles: the state aid interaction problem and the political appetite for expanding compliance burdens on EU downstream manufacturers.
The state aid interaction is the primary technical barrier. Article 10a(6) compensation paid to EU aluminium smelters for indirect ETS costs cannot simply coexist with a CBAM indirect charge on competing imports without triggering WTO non-discrimination concerns. Resolving this requires either discontinuing the compensation (which EU producers oppose) or redesigning the CBAM indirect methodology to account for domestic compensation levels. Neither path is straightforward.
The downstream exposure problem compounds the challenge. The proposed downstream expansion under COM(2025)989 would extend CBAM to approximately 180 finished goods containing aluminium as of January 1, 2028 (pending approval). Adding an indirect emissions layer on top of a downstream expansion simultaneously would increase the compliance burden significantly, particularly for EU automotive and packaging importers.
Is There Any Precedent for Pricing Indirect Emissions Under CBAM?
Cement and fertilizers establish that precedent exists. Both sectors include indirect emissions in their CBAM scope, and neither is listed in Annex II. The reason is symmetrical: EU cement and fertilizer producers do not receive Article 10a(6) compensation for indirect ETS costs, so including indirect costs in CBAM creates no domestic asymmetry. If the Commission phased out aluminium indirect compensation under the ETS, the technical barrier to extending CBAM indirect coverage would dissolve. The political timeline for that change remains unresolved as of April 2026.
Does the Default Value for Aluminium Capture Any Indirect Cost?
CBAM default values are calculated from actual production data submitted during the transitional period, so they reflect real-world emission intensities at actual installations. For a Chinese smelter, the default value incorporates the carbon intensity of China's grid in the specific region where the smelter operates. However, the default value is still applied only to the direct emissions scope. The indirect component embedded in the default calculation process is not a billable item under the current regulation. For a full breakdown of how default values are set and what the mark-up schedule means for your cost planning, see CBAM default values.
How Does Electricity Grid Intensity Affect CBAM Competitiveness for Aluminium Exporters?
Grid intensity shapes competitive outcomes in two directions simultaneously. Exporters on low-carbon grids, such as Norwegian and Icelandic producers using hydropower, face negligible direct emissions and benefit from Annex III CBAM exemptions. Their products arrive in the EU with no CBAM cost. Exporters on coal-heavy grids, such as those in China and India, face a direct emissions charge but are shielded from the far larger indirect cost. This shielding narrows the competitive gap between clean and high-carbon producers more than a full-scope CBAM would. Exporters in the UAE and Bahrain, operating on natural gas grids with emission intensities of approximately 0.5–0.6 tCO₂/MWh, occupy a middle position. Their indirect costs are real but lower than coal-grid competitors. For exporters assessing their long-term position, read the analysis on CBAM impact on aluminium exporters.
Are Perfluorocarbons a Larger Cost Driver Than CO₂ for Some Producers?
PFC emissions can exceed CO₂ emissions on a CO₂e basis for older smelters operating with poor anode effect management. CF₄ carries a GWP of 6,630, meaning even small absolute volumes generate large CO₂e figures. A smelter emitting 0.1 kg CF₄ per tonne of aluminium adds 0.663 tCO₂e per tonne to the CBAM declaration, equivalent to 44% of the base CO₂ direct emission factor of 1.5 tCO₂/t. Modern smelters in Scandinavia and Western Europe have reduced anode effects to near zero. The difference between best-practice and worst-practice PFC management is therefore a material cost differentiator in verified CBAM submissions. For more detail on how PFCs interact with the CBAM reporting obligation, see the article on perfluorocarbons and CBAM.
What Is the Practical Compliance Checklist for Aluminium Importers?
The compliance steps for an EU importer of aluminium goods in the definitive phase fall into three phases. For importers who have not yet begun, the authorization window is still open but narrowing toward the March 31, 2026 deadline.
The checklist for aluminium importers in 2026 is organized by phase below.
- Authorization phase (by March 31, 2026): Submit authorized declarant application to the competent national authority; include 5 years of customs and tax compliance documentation.
- Data collection phase (full year 2026): Collect verified direct emission reports from each non-EU supplier installation; request PFC reporting separately if supplier uses older reduction technology.
- Declaration phase (by September 30, 2027): File the first annual CBAM declaration via the EU CBAM registry, surrendering certificates equal to verified embedded direct emissions after applying any applicable Article 9 carbon price deductions.
EU importers sourcing from multiple origins should model the default value cost now, because the 2027 mark-up rises from +10% to +20% above the calculated default. Importers with actual verified data below the default have a growing financial incentive to use actual values from 2027 onward. For a complete compliance workflow specific to aluminium importing businesses, see CBAM compliance for aluminium importers.
Caption: The net CBAM cost for aluminium importers remains low in 2026 but accelerates steeply as free allocation phases out toward full pricing by 2034.