CBAM steel calculation determines the certificate obligation for every EU importer of steel goods, with the production route driving a 4x difference in embedded emissions between the two dominant methods. Blast furnace-basic oxygen furnace (BF-BOF) steel carries approximately 2.0 tCO₂ per tonne of crude steel, while electric arc furnace scrap-based (EAF) steel registers approximately 0.5 tCO₂ per tonne under Regulation (EU) 2023/956. Understanding which route produced your import, and applying the correct benchmark or actual emissions figure, is the single most consequential step in managing CBAM steel compliance from January 1, 2026 onward.
The full EU CBAM guide sets out the certificate framework that governs these calculations. This article details the step-by-step method for quantifying embedded emissions in steel imports, comparing BF-BOF and EAF routes, applying official benchmark values, and understanding when actual emissions data reduces your financial obligation.
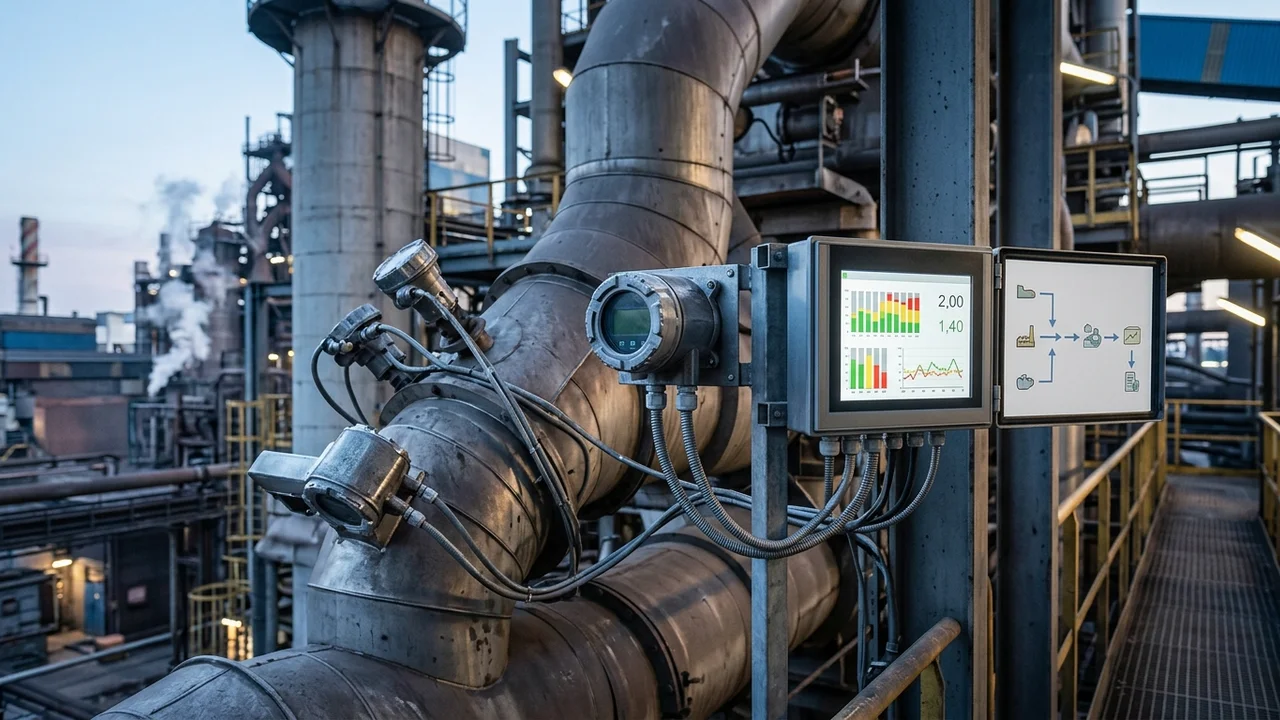
Caption: The BF-BOF route generates approximately 4x the embedded CO₂ per tonne compared to scrap-based EAF production, a gap that drives CBAM certificate cost differentials for EU importers.
What Are Embedded Emissions in CBAM Steel Calculations?
Embedded emissions for CBAM steel are the direct CO₂ emissions released during steel production, measured in tonnes of CO₂ equivalent per tonne of crude steel, covering only direct process and fuel combustion emissions at the production installation.
Steel is listed in Annex II of Regulation (EU) 2023/956, which means indirect emissions from electricity consumption are excluded from the CBAM calculation. Only direct emissions count. This contrasts with cement and fertilizers, where electricity-related indirect emissions are also priced. For steel, coke combustion in the blast furnace, oxygen lancing in the basic oxygen furnace, and the electric arc itself constitute the relevant emission boundary.
Step-by-Step CBAM Steel Calculation
The 4-step process for calculating CBAM embedded emissions for steel imports is outlined below.
Step 1: Classify the Production Route
Route classification determines which emission factor applies. The 3 production routes covered under CBAM are listed below, each with its classification threshold.
- BF-BOF (Blast Furnace, Basic Oxygen Furnace): More than 50% of crude steel mass originates from blast furnace pig iron. This route dominates in China, India, and Russia.
- Scrap-EAF (Electric Arc Furnace, scrap-based): More than 50% of crude steel mass originates from recycled scrap. This route dominates in Turkey, Italy, and Spain.
- DRI-EAF (Direct Reduced Iron, Electric Arc Furnace): More than 50% of crude steel mass originates from direct reduced iron. This route is growing in the Middle East and India.
Route classification is required for every shipment covered under CN codes in Chapters 72 and 73 of the EU Combined Nomenclature. Key codes include 7206, 7207, 7208 through 7212, 7213 through 7217, and 7301 through 7307.
Step 2: Select Actual Emissions or CBAM Default Values
Two emission data sources exist for CBAM steel declarations. Actual emissions, obtained from a verified third-party verifier using the monitoring methodology in Implementing Regulation (EU) 2025/2547, take precedence when available and verifiable. Default values from Implementing Regulation (EU) 2025/2621 apply when actual emissions are not verifiable or not provided.
The official CBAM benchmark values for steel production routes are shown in the table below.
| Production Route | CBAM Benchmark (tCO₂e/t crude steel) | Actual Emission Range |
|---|---|---|
| BF-BOF | 1.370 | 2.0–2.5 tCO₂/t |
| DRI-EAF | 0.481 | 0.4–0.6 tCO₂/t (gas-based) |
| Scrap-EAF | 0.072 | 0.3–0.5 tCO₂/t |
| China-specific default (steel slab) | 3.167 | Varies by mill |
The China-specific default of 3.167 tCO₂e/t represents a 131% premium over the BF-BOF benchmark of 1.370. This gap creates a direct financial incentive for Chinese producers to provide verified actual emissions data, since most Chinese BF-BOF mills operate in the 2.0–2.5 tCO₂/t actual range, which falls well below the country default.
Default values carry a mark-up under Implementing Regulation (EU) 2025/2621: 10% above the calculated default in 2026, rising to 20% in 2027 and 30% from 2028 onward. Actual emissions do not carry this mark-up.
Step 3: Apply the Embedded Emissions Formula
Specific embedded emissions (SEE) are calculated using the formula below.
The SEE calculation for direct emissions uses this structure: SEE = (Direct process emissions + Direct fuel combustion emissions) ÷ tonnes of crude steel produced
For a BF-BOF facility with a monthly output of 50,000 tonnes and total monitored direct emissions of 100,000 tCO₂ in that period: SEE = 100,000 ÷ 50,000 = 2.0 tCO₂/t
Precursor emissions flow through via mass-balance allocation. Hot-rolled coil (CN 7208) used as a precursor for cold-rolled products or coated steel carries its embedded emissions forward into the downstream product declaration. Importers receiving downstream steel products must account for the precursor's SEE, not re-calculate from raw material.
Step 4: Calculate the Gross CBAM Obligation
Once the specific embedded emissions figure is confirmed, the gross CBAM cost per tonne is:
Gross CBAM cost = SEE × EU ETS certificate price
At the current EU ETS price of approximately €70/tCO₂ (as of late March 2026), the gross CBAM cost at reference emission factors is as follows.
| Steel Type | Emission Factor (tCO₂/t) | Gross Cost @ €70/tCO₂ | Net Cost in 2026 (2.5% CBAM factor) |
|---|---|---|---|
| BF-BOF | ~2.0 | ~€140/t | ~€3.50/t |
| DRI-EAF (gas) | ~1.0 | ~€70/t | ~€1.75/t |
| Scrap-EAF | ~0.5 | ~€35/t | ~€0.88/t |
The 2026 net cost is small because 97.5% of ETS free allocation remains in place, meaning the CBAM factor applied to gross cost is 2.5%. This changes sharply: by 2030 the CBAM factor reaches 48.5%, raising the net BF-BOF cost to approximately €67.90/t at €70/tCO₂. Compliance planning must account for the 2029–2030 free allocation cliff, not just 2026 obligations.
What Is the CBAM Certificate Obligation for Steel Importers?
The CBAM certificate obligation is the financial step that follows the emissions calculation. For a full explanation of how embedded emissions are calculated across all CBAM sectors, including the interaction between actual and default values, see the dedicated compliance reference.
Steel importers who are authorized declarants must hold CBAM certificates proportional to their cumulative embedded emissions at each quarterly review point. The quarterly holding requirement is at least 50% of cumulative embedded emissions since the start of the calendar year. The first CBAM declaration covering calendar year 2026 is due September 30, 2027. Certificate sales begin February 1, 2027, priced at the quarterly average EU ETS auction clearing price for 2026 declarations, then switching to the weekly average from 2027 onward.
How BF-BOF and EAF Differ in CBAM Calculation
The core difference between BF-BOF and EAF in CBAM calculation lies in the emission source and measurement boundary. For BF-BOF, the dominant CO₂ source is coke combustion in the blast furnace, which accounts for approximately 70–80% of total direct emissions per tonne, with secondary contributions from limestone calcination in the BOF and fuel combustion in auxiliary processes. For scrap-EAF, the dominant source is electrode consumption and electric arc plasma generation, contributing approximately 0.3–0.5 tCO₂/t without any blast furnace chemistry.
The CBAM steel sector guide covers the full range of CN codes and trade data relevant to EU importers.
The practical implication for importers is that a BF-BOF steel slab from India at 2.0 tCO₂/t generates a gross CBAM cost of €140/t at €70 ETS. The same tonne produced via scrap-EAF in Turkey at 0.5 tCO₂/t generates €35/t. This €105/t difference in gross obligation is why production route verification is the most financially critical input in the CBAM steel calculation process.
Scrap content changes the classification. A facility blending iron ore-derived pig iron and scrap must track the mass ratio continuously. When scrap exceeds 50% of crude steel mass, the Scrap-EAF benchmark of 0.072 tCO₂e/t applies rather than the BF-BOF benchmark of 1.370. The financial difference at scale is significant: a 10,000-tonne monthly import position shifts from 13,700 tCO₂e (BF-BOF benchmark) to 720 tCO₂e (Scrap-EAF benchmark).
Caption: Quarterly certificate holding requirements for BF-BOF steel importers, showing the increasing obligation as the CBAM factor rises from 2.5% in 2026 toward 48.5% in 2030.
Supplementary Reference: CBAM Steel Calculation FAQs
Does scrap input reduce embedded emissions in CBAM declarations?
Pre-consumer and post-consumer scrap carry zero embedded emissions in CBAM calculations. A BF-BOF facility that charges 20% scrap into the basic oxygen furnace reduces its measured direct emissions per tonne proportionally, and this reduction is captured when actual emissions from verified monitoring are used. Default value calculations do not automatically adjust for scrap rate unless the facility's route classification changes to Scrap-EAF (requiring more than 50% scrap in the crude steel mass balance).
What happens if a steel exporter does not provide actual emissions data?
The country-specific or generic default value from Implementing Regulation (EU) 2025/2621 applies, with the applicable mark-up: 10% above the calculated default in 2026. For Chinese BF-BOF producers, this means the slab default of 3.167 tCO₂e/t plus a 10% mark-up in 2026, resulting in a declared SEE of approximately 3.484 tCO₂e/t. At €70/tCO₂, this produces a gross CBAM cost of approximately €243.88/t, compared to approximately €140/t for a verified actual emission of 2.0 tCO₂/t. The financial incentive to provide verified data is approximately €103.88 per tonne for 2026 at current ETS prices, rising as ETS prices increase and as the default mark-up steps up to 20% in 2027 and 30% from 2028.
Is DRI-EAF calculated differently from scrap-EAF under CBAM?
DRI-EAF and scrap-EAF use separate benchmarks. DRI-EAF carries a benchmark of 0.481 tCO₂e/t, approximately 6.7 times higher than the Scrap-EAF benchmark of 0.072 tCO₂e/t. The higher DRI-EAF value reflects natural gas consumption in the direct reduction shaft furnace, which does not occur in purely scrap-based EAF routes. When hydrogen DRI (green steel) replaces natural gas DRI, actual emissions approach 0.0–0.1 tCO₂/t, well below both benchmarks.
Are CBAM embedded emissions calculated on gross or net steel production?
The calculation uses net production output, meaning the weight of crude steel actually produced at the installation, after accounting for in-process losses. Importing declarations reference the tonne weight of the CBAM good as imported, not the total facility production. For complex goods such as pipes (CN 7303–7307) or structural sections (CN 7308), the embedded emissions of the upstream precursor steel carry through to the finished product declaration via mass-balance allocation rules.
Do EU importers or exporters calculate CBAM embedded emissions?
The calculation responsibility rests with the EU authorized declarant (the EU importer), who submits the CBAM declaration by September 30, 2027 for calendar year 2026. However, the embedded emissions data itself must come from the non-EU producer's installation. In practice, this means non-EU steel exporters must generate and have verified the actual emissions data at the production installation level, then communicate this to their EU buyers. Exporters that do not provide verified data force their EU importer partners to use the country default, which typically results in a higher CBAM cost and a price disadvantage for that exporter relative to lower-emission competitors.
Can carbon costs paid in the country of production reduce CBAM obligations?
Article 9 of Regulation (EU) 2023/956 allows a deduction for carbon prices effectively paid in the country of production. South Korean exporters, for example, pay costs under the Korea ETS (K-ETS). At an approximate K-ETS price of €6.40/tCO₂ and a BF-BOF emission factor of 2.0 tCO₂/t, the Article 9 deduction is approximately €12.80/t gross, reducing net CBAM exposure. Countries without any carbon pricing scheme, including Turkey and India for steel, receive no Article 9 deduction. The deduction grows in importance as the CBAM factor rises post-2030, when the gross CBAM cost itself becomes substantial.
BF-BOF vs EAF: Which Production Route Faces Lower CBAM Costs?
Scrap-EAF production faces substantially lower CBAM costs at every ETS price point. The Scrap-EAF benchmark of 0.072 tCO₂e/t is approximately 19 times lower than the BF-BOF benchmark of 1.370 tCO₂e/t. Importers sourcing EAF-origin steel from low-emission producers in Turkey (EAF scrap is dominant in Turkish mills) can substantially reduce their CBAM certificate obligation relative to importing equivalent volumes of BF-BOF origin steel. For detailed production-route profiles by exporting country, visit BF-BOF steel and CBAM and EAF scrap steel and CBAM.
Should importers use CBAM default values or request actual emissions from suppliers?
Actual emissions data, verified under the methodology of Implementing Regulation (EU) 2025/2547, produces a lower declared SEE for the large majority of steel producers compared to the country default. The financial case for requesting actual data strengthens year over year as default mark-ups increase and as the CBAM factor applied to gross costs rises. For 2026, the cost differential is modest given the 2.5% CBAM factor. From 2027, when the default mark-up reaches 20% and certificate sales begin, the argument for verified actual emissions becomes commercially compelling for any import relationship exceeding 50 tonnes annually. The de minimis threshold is 50 tonnes annual mass per importer across all CBAM-covered steel goods. Importers below this threshold are exempt from the declaration obligation entirely.
For the full CBAM compliance workflow, including default value tables by product and country, see CBAM default values. EU importers managing multiple CBAM-covered goods should also review CBAM compliance for steel importers for the authorization timeline and quarterly holding requirement details.