CBAM decarbonization investment generates a measurable financial return for non-EU exporters when reduced actual emissions translate into lower certificate costs paid by EU importers, a cost reduction that the importer passes back as a higher purchase price. Under Regulation (EU) 2023/956, the definitive phase began January 1, 2026, and the free allocation phase-out now runs through 2034, making the financial math of green investment increasingly clear. The question is not whether decarbonization pays under CBAM — it is at what ETS price level and in which year your specific production investment crosses into positive financial territory.
This article walks through the breakeven analysis exporters need, sector by sector, using confirmed emission factors and the free allocation schedule that determines when certificate costs become material enough to justify capital expenditure.
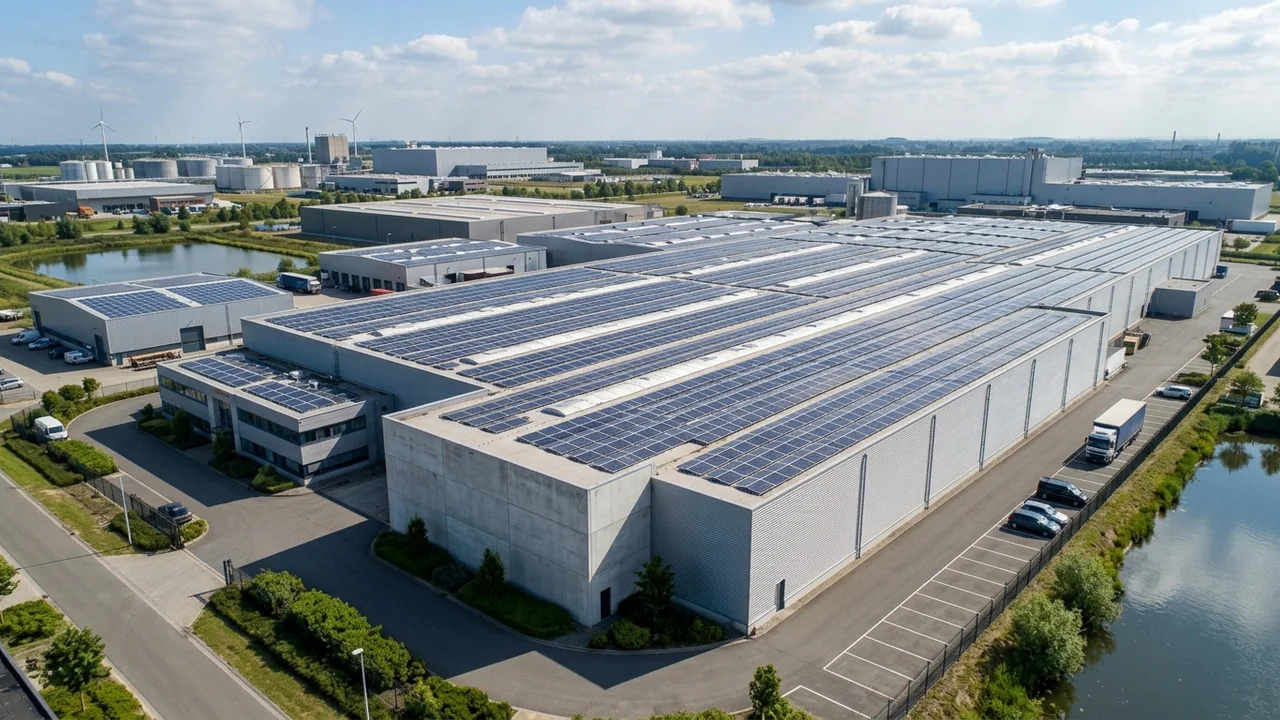
Caption: Lower-carbon production routes reduce the embedded emissions figure on which CBAM certificate costs are calculated, directly lowering the importer's liability.
What Does CBAM Decarbonization Mean for Exporters?
CBAM decarbonization for exporters means reducing the specific embedded emissions per tonne of exported product below the default value or below a competitor's verified emissions figure, so that the EU importer's certificate obligation shrinks. The exporter has no direct legal CBAM obligation — the authorized CBAM declarant (the EU importer) purchases and surrenders certificates. However, the cost flows back commercially: importers pay less for certificates when your verified emissions are lower, and they can afford to pay you more per tonne as a result. This commercial mechanism is the core reason that decarbonization and CBAM are financially linked for exporters.
The EU CBAM guide explains the full certificate purchase process for importers and why embedded emissions data from the production installation determines the certificate quantity required. Understanding this link is the first step before modeling whether green investment justifies the cost.
Two distinct financial benefits follow from decarbonization. First, a producer with verified actual emissions below the default value avoids the default mark-up, which reaches 30% above the calculated default from 2028 onward under Implementing Regulation (EU) 2025/2621. Second, a producer who genuinely reduces embedded emissions below those of competitors gains a price advantage with EU buyers who are competing on CBAM compliance cost. For non-EU exporters seeking to defend EU market share, these two benefits form the financial case for EU CBAM guide-aligned production planning.
Why the Free Allocation Schedule Determines Payback Period
The CBAM factor, the percentage of free ETS allocation that has been phased out and therefore creates a real certificate obligation, rises steeply between 2026 and 2034. The net cost to an importer in any year equals the gross CBAM cost multiplied by the CBAM factor for that year. Decarbonization investment must be evaluated against this rising cost trajectory, not against today's minimal exposure.
The free allocation phase-out schedule confirmed in Regulation (EU) 2023/956, as amended by Regulation (EU) 2025/2083, is as follows. In 2026, the CBAM factor stands at 2.5%, leaving 97.5% of free allocation intact. By 2028 the CBAM factor reaches 10%, by 2029 it reaches 22.5%, and by 2030 it reaches 48.5%. The steepest single-year jump — from 22.5% to 48.5% — occurs between 2029 and 2030. Full phase-out is complete by January 1, 2034 at 100%.
An exporter who decides in 2026 that the €3.75/t net CBAM surcharge on BF-BOF steel (at €75/tCO₂ ETS) is too small to justify action will face €72.75/t net in 2030 from the same importer relationship, a 19-fold increase over four years. Investment decisions made in 2026 and 2027 determine whether a producer is positioned ahead of this cost cliff or is reacting to it.
The CBAM for non-EU exporters section covers the full commercial impact chain and the strategic options available beyond decarbonization, including data submission, cost pass-through, and market diversion. The decarbonization route takes the longest to implement but produces the most durable competitive advantage because the cost reduction compounds as the CBAM factor rises.
Green investment payback also depends on the EU ETS carbon price, which was approximately €70/tCO₂ in late March 2026, within the Q1 2026 range of €66–90/tCO₂. Long-term forecasts from analysts place the 2030 price at €100–150/tCO₂. Every €10 increase in the ETS price raises the gross CBAM cost by €10 multiplied by the emission factor of the product, making the financial return from reducing that emission factor proportionally larger.
For exporters whose production process qualifies for an Article 9 deduction because their home country operates an effective carbon pricing scheme, the CBAM for non-EU exporters guide explains the qualification criteria in detail.
Breakeven Analysis: When Does Decarbonization Investment Pay Off?
The breakeven point for a decarbonization investment occurs when the cumulative annual certificate cost reduction equals the annualized capital cost of the investment. Three ETS price scenarios and three production routes are presented below to illustrate how the breakeven year shifts. The analysis uses BF-BOF steel as the reference case because it carries the highest emission factor of any commonly traded CBAM product at approximately 2.0 tCO₂ per tonne.
The investment assumption: a BF-BOF steelmaker invests in a partial DRI-EAF transition or hydrogen injection that reduces specific embedded emissions from 2.0 tCO₂/t to 1.2 tCO₂/t (a 40% reduction). The annual volume of EU-bound exports is 100,000 tonnes. The annualized capital cost of the investment is assumed at €5 million per year over a 15-year depreciation period.
| ETS Price | Emission Reduction (per tonne) | Gross Cost Saving/t | 2026 Net Saving (2.5%) | 2028 Net Saving (10%) | 2030 Net Saving (48.5%) | Breakeven Year |
|---|---|---|---|---|---|---|
| €50/tCO₂ | 0.8 tCO₂/t | €40/t gross | €1.00/t = €100,000/yr | €4.00/t = €400,000/yr | €19.40/t = €1.94M/yr | 2031–2032 |
| €70/tCO₂ | 0.8 tCO₂/t | €56/t gross | €1.40/t = €140,000/yr | €5.60/t = €560,000/yr | €27.16/t = €2.72M/yr | 2029–2030 |
| €100/tCO₂ | 0.8 tCO₂/t | €80/t gross | €2.00/t = €200,000/yr | €8.00/t = €800,000/yr | €38.80/t = €3.88M/yr | 2028–2029 |
Assumptions: 100,000 t/yr EU export volume; annualized investment cost €5M/yr; breakeven = cumulative savings exceed cumulative annualized capital. ETS held constant for simplicity. Actual ETS is expected to rise, which accelerates breakeven.
Three findings stand out from this table. At a €70 ETS price (the current market level), the breakeven arrives in 2029–2030 for a mid-scale BF-BOF steel investment. At €100/tCO₂, which consensus forecasts place at or before 2030, the breakeven advances to 2028–2029. At €50/tCO₂, breakeven slides to 2031–2032, but the financial logic still holds within the decade.
The same logic applies to cement, aluminium, and fertilizers, but the numbers shift based on sector-specific emission factors. Cement Portland carries an emission factor of approximately 0.83 tCO₂/t, making absolute gross cost savings smaller per tonne but still material for high-volume exporters. Urea fertilizer at approximately 2.5 tCO₂/t carries the highest emission factor outside hydrogen, and green ammonia production routes bring embedded emissions to near zero — making the CBAM decarbonization case for fertilizer exporters especially compelling for producers who have access to low-cost renewable energy.
Caption: Clinker-to-cement ratio reduction and alternative fuel substitution lower the embedded emissions figure that CBAM certificate calculations are based on.
Which Decarbonization Routes Reduce CBAM Liability Most Effectively?
Four decarbonization pathways reduce embedded emissions in CBAM-covered sectors. The financial return from each pathway under CBAM depends on the magnitude of emission reduction achieved, the capital cost required, and the timeline to deployment.
The four pathways applicable to most CBAM-exposed exporters are listed below.
- Fuel switching in cement kilns: Substituting alternative fuels (biomass, waste-derived fuels) for coal in the calcination process reduces fuel combustion emissions, which represent approximately 40% of Portland cement's total embedded emissions. Clinker-to-cement ratio reduction (increasing the proportion of supplementary cementitious materials such as blast furnace slag, fly ash, or calcined clay) addresses the remaining 60% from limestone calcination. Combined, these approaches can reduce Portland cement emissions from 0.83 tCO₂/t toward 0.55–0.65 tCO₂/t, a reduction that becomes economically significant at a 48.5% CBAM factor and €70+ ETS price.
- DRI-EAF transition for steel: Direct reduction iron making using natural gas (or green hydrogen) fed into an electric arc furnace reduces emissions from the BF-BOF route's approximately 2.0 tCO₂/t toward 0.9–1.4 tCO₂/t for gas-DRI-EAF and approaching 0.3–0.5 tCO₂/t for hydrogen-DRI-EAF. The capital requirement is high (€300–600 per tonne of annual steel capacity for full transition), but the CBAM liability reduction at a 48.5% factor and €100 ETS price generates €70–95/t in annual certificate cost savings for a BF-BOF-to-H-DRI exporter — the strongest financial case in any CBAM sector.
- Green ammonia for fertilizer producers: Switching from natural gas-based Haber-Bosch ammonia synthesis (approximately 9–12 tCO₂/t NH₃ in grey hydrogen feedstock terms) to electrolysis-based green hydrogen reduces urea embedded emissions to near zero. The CBAM cost on grey-hydrogen-based urea at €70 ETS and 48.5% factor reaches approximately €44/t urea, a cost that disappears entirely under green ammonia routes. Exporters in regions with low-cost renewable electricity (Morocco, Chile, Australia, parts of the Middle East) have the most favorable cost basis for this transition.
- Renewable electricity supply for aluminium smelting: Primary aluminium's CBAM liability under a coal-heavy grid reaches 8–10 tCO₂/t including indirect electricity emissions for countries where indirect emissions are captured in defaults. While CBAM's financial obligation covers only direct emissions (approximately 1.5 tCO₂/t), default values reflect total emissions including electricity. Switching to renewable-sourced electricity and submitting verified actual data eliminates the indirect emissions component from default penalty calculations, reducing effective liability significantly.
The Article 9 carbon price deduction provides an additional mechanism for exporters in countries with qualifying carbon pricing schemes. When a domestic carbon price has been effectively paid, the EU importer can deduct the equivalent amount from the CBAM certificate obligation. The CBAM Article 9 carbon price deduction page covers the qualification criteria and calculation method in full.
How to Evaluate Whether Decarbonization or Data Submission Pays Off First
Exporters face a sequencing decision: submit verified actual emissions data first (which can be done within 6–18 months) or begin capital investment in decarbonization (which requires 3–10 years). The two options are not mutually exclusive, but the short-term financial return on data submission is immediate and the upfront cost is lower.
The five-step decision sequence exporters use to evaluate the right approach is presented below.
- Obtain a preliminary gap estimate: compare your production installation's estimated actual emissions against the applicable default value. Defaults for steel slab from China are 3.167 tCO₂e/t against typical actual Chinese BF-BOF emissions of 1.8–2.1 tCO₂e/t — a gap of approximately 1.0–1.4 tCO₂e/t that represents €34–48/t in CBAM cost savings in 2030 from data submission alone.
- Calculate the annualized cost of verification: third-party verifier fees run €5,000–€50,000 per installation per reporting period under EN ISO/IEC 14065 accreditation. For a 100,000-tonne annual exporter, this is €0.05–€0.50/t, which is negligible against the default gap cost.
- Model the residual liability after data submission: if actual emissions are already below the default but still high in absolute terms, calculate what CBAM certificate cost remains at 2030 ETS prices and CBAM factor. This is the liability that decarbonization investment addresses.
- Identify the capital cost of the relevant decarbonization pathway and annualize it over an expected asset life.
- Calculate the year in which cumulative annual certificate savings exceed the cumulative annualized capital cost — that is your breakeven year. If breakeven falls before 2034 at conservative ETS assumptions, the investment is financially rational.
Understanding how embedded emissions are calculated is essential for this analysis, because the specific embedded emissions figure is the quantity that multiplies against the ETS price to determine certificate liability.
Frequently Asked Questions on CBAM Decarbonization for Exporters
Does reducing emissions always reduce the CBAM certificate cost?
Reducing embedded emissions reduces the certificate quantity the EU importer must purchase, which reduces the importer's CBAM cost. The importer's reduced cost improves their willingness to pay a higher price for your goods. However, reductions only produce a financial benefit proportional to the current CBAM factor: in 2026, only 2.5% of the gross certificate obligation is real. The same emission reduction that saves €1.40/t in 2026 saves €27.16/t in 2030 (at €70 ETS, 48.5% factor). Decarbonization investment made today is priced against the 2026 environment but delivers its returns in the 2028–2034 window.
What is the minimum emission reduction that justifies decarbonization investment under CBAM?
No universal minimum exists because the breakeven depends on export volume, capital cost, ETS price, and the specific emission factor of your product. The calculation that determines whether any emission reduction justifies investment is: (emission reduction in tCO₂/t) × (annual export volume in tonnes) × (ETS price) × (CBAM factor in the relevant year) = annual certificate cost saving. This annual saving must, when summed over the investment life, exceed total capital expenditure. For a 100,000-tonne BF-BOF steel exporter at €70 ETS, reducing emissions by 0.5 tCO₂/t generates €1.75M in annual savings at the 2030 CBAM factor. For most realistic capital investment sizes, that represents a positive return.
Can a non-EU exporter claim the Article 9 deduction instead of decarbonizing?
The Article 9 deduction and decarbonization are separate mechanisms that serve different financial functions. The Article 9 deduction reduces the certificate obligation by the amount of carbon price effectively paid in the country of production — it does not reduce actual embedded emissions. It is available only when the home country operates a qualifying carbon pricing scheme. Decarbonization reduces the embedded emissions figure itself, which reduces the certificate obligation regardless of whether a carbon price exists in the exporting country. Exporters in countries without qualifying carbon pricing, such as Turkey, India, and China as of 2026, cannot use Article 9 and must rely on actual emissions data submission and decarbonization investment to reduce CBAM exposure.
Is decarbonization investment recognized differently from default value submission under CBAM?
CBAM certificates are calculated on specific embedded emissions expressed in tCO₂e per tonne of goods. Whether those emissions are low because the producer submitted verified actual data that happens to be below the default, or because the producer genuinely invested in lower-carbon technology, makes no difference to the certificate calculation. The certificate quantity is the same for 1.0 tCO₂/t of actual emissions whether those come from efficient BF-BOF operation or from a new DRI-EAF installation. The financial advantage of capital-intensive decarbonization over data submission lies in the absolute level of emissions achieved, not in any preferential regulatory treatment.
Does the EU ETS price dropping reduce the value of CBAM decarbonization?
A lower ETS price reduces the gross CBAM cost and therefore reduces the annual certificate saving from any given emission reduction. The breakeven year shifts later as the ETS price falls. However, the EU ETS cap reduces by approximately 4.3% per year from 2024 onward under the revised ETS Directive, creating structural upward pressure on the price. The Q1 2026 range of €66–90/tCO₂ reflects volatility from policy uncertainty, not a collapse in the structural price floor. Long-term consensus forecasts for 2030 remain at €100–150/tCO₂. Exporters modeling decarbonization investment returns at €50/tCO₂ are using a conservative assumption that still produces a positive return within the 2026–2034 phase-out window for most high-emission products.
What exporter CBAM verification steps are needed before decarbonization savings can be recognized?
Verified actual emissions data is the prerequisite for any CBAM certificate reduction based on decarbonization. The EU importer cannot use a producer's self-declared lower emissions — the data must be verified by an accredited third-party verifier under EN ISO/IEC 14065, with a mandatory physical site visit for the first verification period (2026 imports). The verifier confirms accuracy of activity data, appropriateness of emission factors, and correctness of the calculation methodology under Implementing Regulation (EU) 2025/2547. Until verified data is submitted and accepted by the authorized CBAM declarant, default values apply regardless of actual production emissions. The CBAM verification for non-EU producers page details the site visit requirements and verifier accreditation routes for non-EU installations.
How does the CBAM exporter strategy change when decarbonization investment is underway?
An exporter who has committed to a 5–10 year decarbonization program needs to manage CBAM liability during the investment period, not only after completion. The CBAM exporter strategy guide addresses the interim period options: submitting verified actual data now (which captures savings on emissions already lower than default), identifying whether partial improvements can be verified annually as work progresses, and pricing EU contracts to reflect the transition cost trajectory rather than the current-year CBAM exposure. Failing to adjust contract pricing during the investment period means absorbing both the capital cost of decarbonization and the diminishing but still real CBAM certificate cost simultaneously.
How are embedded emissions calculated for multi-step production processes?
Embedded emissions for CBAM goods that use CBAM-covered precursors (for example, cement made from clinker, or aluminium profiles made from unwrought aluminium) must include the precursor's embedded emissions. The calculation methodology is defined in Implementing Regulation (EU) 2025/2547 and requires the exporter to obtain embedded emissions data from the upstream precursor installation if it differs from the main production facility. For vertically integrated producers, the system boundary covers all process steps linked to production. Understanding how embedded emissions are calculated is essential before modeling the financial impact of reducing emissions at any specific step in the production chain.
Does the EU ETS carbon price affect the Article 9 deduction calculation?
The Article 9 deduction is calculated as the carbon price effectively paid in the country of production per tonne of embedded CO₂, multiplied by the embedded emissions. The EU ETS price does not enter the deduction calculation directly — it enters the CBAM certificate price calculation. As the ETS price rises and CBAM certificates become more expensive, the deduction from a fixed domestic carbon price covers a smaller percentage of the total obligation. This is why South Korea's K-ETS price of approximately $6–7/tCO₂ covers roughly 9% of the CBAM certificate cost at €70/tCO₂. Decarbonization reduces the base quantity of emissions to which both the certificate price and the deduction apply.
Is decarbonization for CBAM compliance the same as decarbonization for EU market access?
CBAM decarbonization is a subset of the broader low-carbon transition. Reducing specific embedded emissions reduces the CBAM certificate obligation. It does not, by itself, satisfy any separate EU market access requirement, corporate sustainability commitment, or supply chain due diligence obligation. However, EU buyers subject to the Corporate Sustainability Due Diligence Directive and voluntary net-zero commitments increasingly apply Scope 3 emission reduction criteria to supplier selection. Decarbonization investment made for CBAM financial reasons therefore generates a secondary benefit in the form of improved competitiveness against any EU buyer applying supply chain carbon criteria, independent of CBAM certificate costs.