CBAM fertilizers regulation, active since January 1, 2026 under Regulation (EU) 2023/956, places urea at approximately 2.5 tCO₂e per tonne, the highest embedded emissions of any common agricultural input traded across borders. Non-EU exporters now face a converging set of pressures: Russia contends with EU sanctions stacked directly on top of CBAM obligations, Egypt has 46% of its fertilizer exports directed at the EU market under CBAM scope, and producers across all origins must account for both CO₂ and N₂O emissions in their embedded emissions calculations.
What does this mean in practice for exporters, and how do the N₂O rules change the calculation for nitrogen fertilizers specifically?
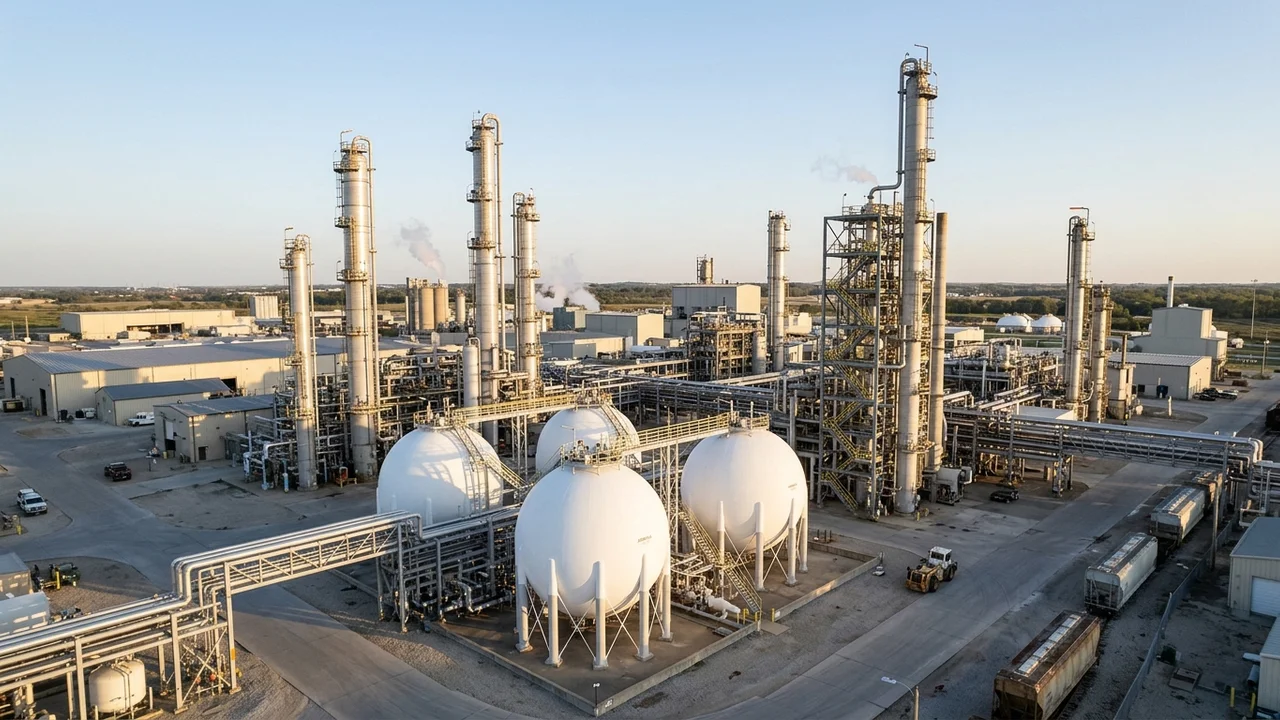
Caption: Fertilizer CBAM covers both CO₂ from natural gas reforming and N₂O from nitric acid production, making nitrogen fertilizers one of the most calculation-intensive CBAM sectors.
Which Fertilizers Fall Under CBAM?
CBAM fertilizers coverage spans both Chapter 28 (inorganic chemicals) and Chapter 31 (fertilizers) of the EU Combined Nomenclature. The 8 covered product categories are listed below.
The covered CN codes for CBAM fertilizers are as follows:
- 2808 00 00: Nitric acid and sulfonitric acids
- 2814 10 00 / 2814 20 00: Anhydrous ammonia and ammonia in aqueous solution
- 2834 21 00: Potassium nitrate
- 3102 10: Urea (above 45% nitrogen by weight), the highest-volume traded product
- 3102 30: Ammonium nitrate (AN)
- 3102 40 / 3102 60: Calcium ammonium nitrate (CAN) and related double salts
- 3102 80: Urea ammonium nitrate (UAN) solutions
- 3105: Mixed N-P-K fertilizers (excluding 3105 60 00, which contains no nitrogen)
The EU carbon border adjustment mechanism applies to all goods in this list once the annual import volume at the declarant level exceeds 50 tonnes. Ammonia (CN 2814) is both a CBAM good in its own right and the primary precursor embedded in every downstream nitrogen fertilizer. Exporters of urea, AN, or UAN must therefore account for the ammonia production stage in their embedded emissions figures.
How Embedded Emissions Are Calculated for Nitrogen Fertilizers
Embedded emissions for CBAM fertilizers cover both direct CO₂ emissions and direct N₂O emissions from production, distinguishing nitrogen fertilizers from steel and aluminium, which cover CO₂ only. Fertilizers are not listed in Annex II of Regulation (EU) 2023/956, which means both direct and indirect emissions (from electricity consumption) are priced, the same scope that applies to cement.
The Haber-Bosch Production Chain
All nitrogen fertilizers trace back to ammonia synthesis via the Haber-Bosch process: N₂ + 3H₂ → 2NH₃. The hydrogen feedstock comes from steam methane reforming (SMR) of natural gas in over 99% of global production facilities: CH₄ + H₂O → CO + 3H₂. This gas-reforming step generates the primary CO₂ emission, approximately 1.6 to 2.4 tCO₂ per tonne of ammonia produced.
For urea specifically, CO₂ captured during reforming is incorporated into the urea synthesis reaction (CO₂ + 2NH₃ → CO(NH₂)₂ + H₂O) and is later released when urea is applied to soil. This soil-application CO₂ remains within CBAM scope because the carbon was captured and chemically fixed during production.
The N₂O Component
N₂O emissions enter the calculation for ammonium nitrate and UAN solutions at the nitric acid production stage. Without catalytic abatement, nitric acid plants emit approximately 6 kg of N₂O per tonne of acid produced. Using the IPCC AR5 global warming potential of 265 for N₂O, this equates to roughly 1.59 tCO₂e per tonne of nitric acid, a material share of total embedded emissions for AN and UAN products.
N₂O from fertilizer application to soil is not in CBAM scope. Only production-stage N₂O is captured. Exporters with modern catalytic N₂O abatement systems installed at their nitric acid plants can document lower actual N₂O intensity and reduce their verified embedded emissions figure relative to default values.
For a detailed walkthrough of how to measure and report these figures, see how embedded emissions are calculated.
Emission Factors by Product
The table below shows the key emission factors for CBAM fertilizers, with gross CBAM cost calculated at the current EU ETS price of approximately €70/tCO₂ (late March 2026 market reference).
| Product | Emission Factor (tCO₂e/t) | Gross CBAM Cost @ €70 | Net Cost in 2026 (2.5% factor) |
|---|---|---|---|
| Anhydrous ammonia (2814) | ~1.6–2.0 | €112–140/t | €2.80–3.50/t |
| Urea (3102 10) | ~2.3–2.6 | €161–182/t | €4.02–4.55/t |
| Ammonium nitrate (3102 30) | ~1.5–2.0 | €105–140/t | €2.63–3.50/t |
| UAN solution (3102 80) | ~1.0–1.5 | €70–105/t | €1.75–2.63/t |
Net costs in 2026 remain low because only 2.5% of EU ETS free allocation has been withdrawn. The gross cost column reflects the full financial exposure that phases in progressively through 2034, when free allocation drops to zero.
Top Fertilizer Exporters to the EU: CBAM Cost and Exposure
Three non-EU countries account for the majority of nitrogen fertilizer imports into the EU. The table below summarizes their CBAM position as of 2026.
| Country | Key Products | Carbon Pricing | Article 9 Deduction | Estimated CBAM Exposure |
|---|---|---|---|---|
| Russia | Urea, AN, ammonia (EuroChem, PhosAgro) | None effective | No | Severely limited by EU sanctions; also faces €40–315+/t additional tariffs |
| Egypt | Urea (OCI, ElSewedy) | None | No | ~46% of fertilizer exports directed to EU market |
| Algeria | Urea, ammonia (Fertial) | None | No | Significant but lower volume than Egypt |
Morocco deserves a separate mention in the longer-term context. OCP Group is investing $7 billion in a green ammonia platform. If realized, green ammonia produced via renewable electrolysis carries near-zero embedded emissions and faces minimal CBAM costs, positioning Morocco to gain EU market share as the CBAM factor tightens through 2030.
For non-EU exporters more broadly, the options for managing CBAM costs are covered in the CBAM for non-EU exporters section of this site.
Russia: Sanctions and CBAM as a Double Burden
Russia faces the most severe compound pressure of any fertilizer exporter. Historically, Russia and Belarus together supplied approximately 34% of EU nitrogen fertilizer imports, with EuroChem and PhosAgro as the dominant producers.
The EU enacted additional tariffs on Russian and Belarusian fertilizers in July 2025. These tariffs start at €40–45 per tonne and escalate to €315–430 per tonne by July 2028. Stacked on top of the pre-existing 6.5% ad valorem customs duty and CBAM certificate costs, Russian urea imports to the EU dropped by approximately two-thirds following the July 2025 implementation date.
CBAM does not exempt sanctioned countries. Russian fertilizer exports that do enter the EU through permitted channels remain subject to CBAM embedded emissions calculations. Russia has no effective domestic carbon pricing scheme, making Article 9 deduction unavailable to EU importers purchasing Russian product. Russia filed WTO dispute DS639 on May 12, 2025 (the only formal WTO challenge to CBAM filed globally), but this covers the mechanism as a whole and provides no near-term commercial relief.
The CBAM Russia page covers the sanctions-CBAM interaction in full detail.
Egypt: 46% EU Market Exposure and No Carbon Pricing
Egypt exports approximately 46% of its fertilizer production to the EU market, concentrated in urea from state-linked and private producers including OCI and ElSewedy. This concentration creates acute CBAM exposure with no offsetting carbon price credit.
Egyptian natural gas-based urea carries embedded emissions in the range of 2.3–2.6 tCO₂e per tonne at the production level. At the EU ETS reference price of €70/tCO₂, the gross CBAM cost sits at €161–182 per tonne of urea. In 2026, the net effective cost remains below €5/t because of the 2.5% free allocation factor. By 2030, when the CBAM factor reaches 48.5%, the net cost at the same ETS price rises to approximately €78–88 per tonne, a significant share of typical urea FOB prices.
Egypt has no qualifying carbon pricing scheme. The EU importer of Egyptian urea cannot apply an Article 9 deduction, meaning the full gross CBAM cost applies minus only the free allocation offset. Egyptian producers who invest in verified emissions monitoring now secure a commercial advantage over those who rely on default values, which carry a 1% mark-up above the calculated default under Implementing Regulation (EU) 2025/2621.
How CBAM Default Values Apply to Fertilizers
The default value mark-up for fertilizers is only 1% above the calculated default. This compares to 10% in 2026 and rising to 30% from 2028 for steel, cement, and aluminium. This narrow mark-up reflects the Commission's recognition of agricultural price sensitivity and food security considerations.
The practical consequence is that the financial gap between using default values and submitting verified actual emissions data is much smaller for fertilizers than for other CBAM sectors. Producers with standard modern natural gas-based plants face limited incentive to invest in full monitoring and verification solely to avoid the default mark-up. The incentive calculation changes, however, for producers who have invested in N₂O abatement, energy efficiency upgrades, or who use renewable electricity in their plants. In those cases, actual emissions fall meaningfully below defaults, and verified data creates a real cost advantage.
CBAM default values for exporters provides the full calculation methodology and mark-up schedule across all sectors.
What Is the Contextual Border Between CBAM Fertilizers and Broader Exporter Strategy?
CBAM fertilizers compliance sits at the intersection of agricultural commodity trade, carbon accounting, and geopolitical trade restrictions. For exporters navigating this environment, the calculation challenge is not only technical but also strategic. EU importers managing the same obligations from the purchasing side should consult CBAM fertilizer importers for the complementary compliance perspective.
How Does the Article 9 Carbon Price Deduction Work for Fertilizer Exporters?
The Article 9 deduction under Regulation (EU) 2023/956 allows EU importers to reduce their CBAM certificate obligation by the amount of carbon price effectively paid in the country of origin. The deduction applies only when the exporting country operates a qualifying carbon pricing scheme, meaning one that is legally binding, effectively enforced, and covers the production installation in question.
No major fertilizer exporting country currently qualifies. Russia, Egypt, Algeria, and Trinidad and Tobago all lack qualifying schemes. This means EU importers of fertilizers from these origins bear the full CBAM certificate cost, which is then typically passed back to exporters via lower purchase prices or contract renegotiation. CBAM Article 9 explains the full qualifying criteria and deduction mechanism.
Does CBAM Apply to Phosphate and Potassium Fertilizers?
CBAM fertilizers scope covers only nitrogen-based products. Phosphate and potassium fertilizers, such as diammonium phosphate (DAP), triple superphosphate (TSP), and muriate of potash (MOP), are not covered under Annex I of Regulation (EU) 2023/956. CN code 3105 60 00 (phosphorus-potassium fertilizers containing no nitrogen) is explicitly excluded. Exporters of NPK blends where nitrogen is present remain in scope under CN 3105; the CBAM calculation applies proportionally to the nitrogen content per kilogram of product.
Does CBAM Affect Fertilizer Prices for EU Farmers?
CBAM fertilizers costs affect EU farmers indirectly through the pricing decisions of EU importers. In 2026, net costs remain below €5 per tonne of urea due to the low CBAM factor. By 2030, net costs rise toward €78–88 per tonne at current ETS price levels, a cost that EU importers will incorporate into their purchasing calculations. EU-based ammonia and urea producers face no CBAM obligation on their own output, which creates a growing relative cost advantage for domestic production as free allocation phases out through 2034.
Is N₂O from Fertilizer Application Included in CBAM Calculations?
N₂O from field application of fertilizers is not included in CBAM scope. Only production-stage N₂O is captured, specifically N₂O generated during nitric acid synthesis for ammonium nitrate and UAN products. Exporters of urea (which involves no nitric acid) therefore have no N₂O component in their embedded emissions calculation. Exporters of AN and UAN do face N₂O inclusion, and their verified emissions data must document whether catalytic abatement is installed and operating at the nitric acid plant.
Can Fertilizer Exporters Use the CBAM Operators Portal?
Non-EU fertilizer producers can upload verified installation-level emissions data directly to the European Commission's CBAM Operators Portal. Uploading verified data to the portal makes it available to all EU buyers simultaneously, and one upload covers multiple importer relationships. The portal accepts the official Communication Template (an Excel-based matrix mapping energy flows, production volumes, and emission calculations to the required CBAM data fields). Data uploaded and verified before the first CBAM declaration deadline of September 30, 2027 (covering calendar year 2026) strengthens the commercial position of exporters who have invested in accurate monitoring.
Caption: Russia faces CBAM costs compounded by EU additional tariffs; Egypt's 46% EU market exposure makes CBAM a central concern for urea exporters with no qualifying carbon price to offset costs.